
Reducing Risk To Accelerate Investments In New Forests - Learnings from our third sprint
Author: Daniel Ronen, UAVaid. March 2024.
Pilot: “Project Sapling - drone-based remote sensing for reforestation investment”
The necessity for climate change mitigation, carbon sequestration, ecosystem restoration, and sustained global demand for timber are all driving the need for increased forest planting activity. The challenge for mass (re)forestation is particularly acute due to the sheer scale of the requirement. Despite widespread public support for replanting and reforestation initiatives, the complexities of operating in remote and difficult to reach areas raise particular challenges and concerns over carbon accounting, and verification challenges in remote and difficult-to-reach regions are causing investor hesitancy and thus slowing down progress and activity.
In late 2022, under the UK Aid Frontier Technologies (FT) programme, a project was established to develop technical innovations to support reforestation verification, with a view to reducing investor hesitancy. This Project Sapling centred on two methodologies: (1) objective verification of the planting process based on the fusion of remote sensing and smartphone collected data for ‘virtual auditing’.; (2) the embedding of local communities in the process as custodians of the forest to ensure sustainability.
The principle was to provide a clear and intuitive verification system to those wishing to invest in reforestation and thus unlock an expansion of investment in this sector. For the communities, the objective was to create a methodology and system whereby ‘a living tree is of more value than a dead one’ by ensuring they benefit from the newly planted forest.
For the project, UAVaid partnered with Tacugama Chimpanzee Sanctuary and Crown Agents, with local implementation and testing conducted in the Loma mountains region of eastern Sierra Leone, in west Africa.
Previous sprints verified the ability of drones for area mapping in remote areas and the use of custom-app enabled smartphones to collect planting data of individual saplings by community workers.
The aim of the third and final sprint was to verify that the core technical methods used for tree planting data collection were fit for purpose and that the processes used for the data fusion and (portal) data display worked as intended.
Specifically, the sprint set out to understand: (i) whether the data captured via the smartphones and drones was viable for fusion and display by the online portal; (ii) that the drone imagery could detect sapling presence and signs of growth at 6 months post-planting; and (iii) the technology could support and record different planting densities to indicate opportunities for scale. The Sprint also sought to understand whether Project Sapling presented an attractive value proposition for investors by better understanding their needs.
The practical culmination of this sprint was a field test in Sierra Leone’s Loma region, scheduled for late November 2023. Unfortunately, this was aborted due to political instability and an attempted coup d’etat in the country. The November events were a reminder of key learning for all activity in this region that events on the ground can change very rapidly in ways that are unexpected or unpredictable, so a need to remain flexible is vital. The timeline was revised to early March 2024. Unfortunately, this new date fell in the dry season making it less than ideal for digging or planting young saplings, but did create opportunities to answer key questions relating to technical capabilities and community integration into an overall planting and verification process.
ITS ALL IN HAND (HELD)
Data collection is a central feature of the technical pilot methodology. The previous sprint saw the successful development and validation of a custom smartphone app for collecting key data on each individual sapling at the point of planting, including geo-location, species and photographic evidence.
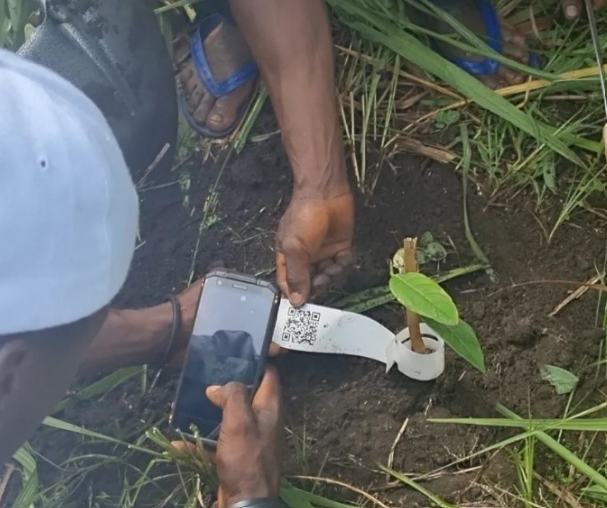
Community worker using the custom app enabled smartphone to scan the QR code on the sapling before taking a verification photograph. (Photograph taken during Sprint 2)
Analysis of these results highlighted some weaknesses, principally around the standard and consistency of photographic evidence.
Photographs had been taken from a wide range of angles and distances, and with no visual reference for scale. This inconsistency made it difficult for the viewer to contextualise the size or relative maturity of the sapling and presented a potential constraint on building investor confidence due to difficulty in making like for like comparisons or visually tracking growth of individual plants and thus increasing perceived risk.
From this analysis, solutions were developed and prepared for testing during the March 2024 field programme. They included:
Standardisation on 0.5m height of sapling for planting, where possible.
The inclusion of a yardstick next to the sapling for the verification photograph.
Changes to the training programme for the community workers using the smartphone so that photographs were taken side-on and with a marked up ‘yardstick’ (with metric marks) to provide an objective height reference.

Visual aids used in the training of the community workers on how to take the verification photographs. By basing the training on pictures instead of text, social inclusion of those with limited literacy skills was maintained.

Community workers taking verification photograph with size reference stick.
The smartphone app training programme for the community workers was graphical and highly experiential with lots of hands-on practise. The revised process for verifying the planting used two people, one to enter the smartphone data/take the photograph and the other to hold the reference stick for the photograph.

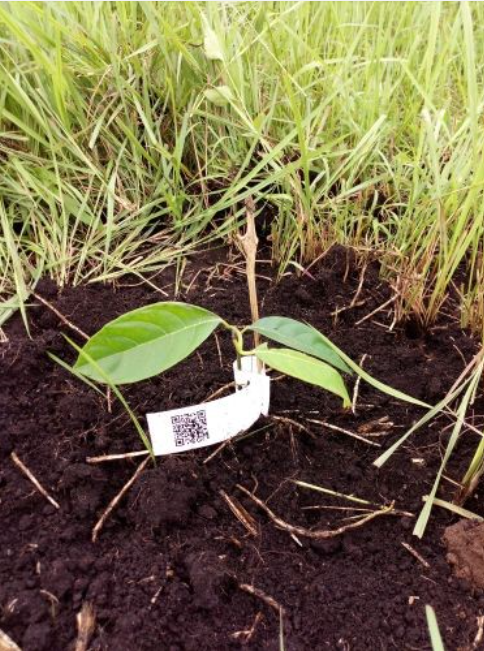
Verification photograph of a planted tree sapling. Clearly visible is the shape and relative size of the plant, together with the QR code tag.
The results of the changes to the photographic verification methodology showed a clear improvement in the standard and consistency of the images produced. Further, the inclusion of a scale reference stick in the images provided additional advantages;
The viewer being able to contextualise and have a scale reference for the size of the plant. This was important as any increase in the integrity and clarity has the potential to reduce risk and build investor confidence in the process.
Present an opportunity to include size data in the later iterations of the methodology. This may be extended to measuring and tracking the growth of individual trees for verification or carbon estimation purposes.
As a side note, it was also observed that the larger saplings drastically reduced the risk and incidence (zero recorded on the day) of the ID tags falling off, something which had been reported from the previous planting in May 2023.
WHAT CAN A DRONE DETECT?
One of the key methods embedded in the pilot methodology is that of remote sensing for verification purposes, with satellites and drones the primary options for data collection. Each option has its own limitations and with (currently available) satellite imagery limited to 15-30cm resolution, this sprint aimed to understand whether the same drones already proven effective in an earlier sprint for mapping remote areas, would also be able to directly detect sapling growth.
This turned out to be a far from simple question to answer.
Initially, drone mapping images taken in May 2023 were analysed to try and identify whether any saplings had been directly observable at that point in time. The intention was to then compare those images with updated ones taken in the same location after 6 months+, with the goal of identifying if / where individual sapling growth could be observed. Unfortunately, the first plot planted in May 2023 was burnt by a local fire, which prevented the possibility of producing a like-for-like comparison.
As a result, the pilot pivoted to an alternative approach which saw the team develop a framework for understanding what may be detectable by remote observation, and why this might be the case.
By analysing the mapping data from May 2023, the team could confirm the intuitive understanding that small green plants on a green background ‘blend in’ and are therefore not easily directly observable. However, it was noted that some of the white QR ID tags were able to be seen, especially when the surrounding ground had been cleared to provide a dark brown ‘background’.

These observations led to the development of a theoretical framework for understanding the observability constraints.

Size - GSD.
GSD (Ground Sample Distance) is the 'real life' size on the ground that each image captured pixel represents and is often called the ‘resolution’. Theory suggests that if, when viewed from above, a sapling has a (leaf) area so small that when directly imaged by a drone (or satellite for that matter) only a small number of pixels are identified. These pixels may be unremarkable to the observer in context to the surrounding ’noise’ and are therefore unlikely to be a reliable form of verification.
Extending this theory suggests that the smaller the GSD, the earlier the object is detectable. Therefore, with a GSD of 3cm, drones should be able to detect saplings at a younger age, and be more sensitive to growth, than other methods of remote observation such as satellites, with GSD of 15-30cm.
Contrast
Analysis of the imagery also suggested that in addition to the GSD / resolution, the colours and shapes of both the plant and its surrounding (ground surface such as soil, grass etc) are highly significant, in the same way that camouflage is used to ‘hide’ objects in plain sight. It was observed that the greater the observable contrast between the item and its background, the easier it was to detect. This was exemplified by the high contrast white tags being significantly more detectable against the dark soil, than green saplings surrounded by green grass, despite being of similar size.
Based on these two variables, a basic theoretical framework was able to be constructed:
Size of sapling when viewed from above relative, to the GSD of the drone imagery.
The visible contrast of the sapling vs the background (ground and surrounding surface).

Whilst field testing was not possible, the team was able to analyse a series of images taken during the March 2024 planting. This showed that smaller plants were observable when their contrast with the surrounding was high, and that large plants themselves were observable. Further, when the plant is large and of high contrast i.e. green canopy against dry brown earth, it becomes even easier to observe.

Analysis of the drone imagery revealed that larger plants and those whose colours contrast with the background are the easiest to observe, circled yellow.
Although it was not possible to directly test whether growth can be detected by drone within the sprint, the experiment did validate the theoretical framework for these two factors which affect observability. This has direct consequences for the project, such as optimum time of year for monitoring (dry season = brown earth = greater observability) and will inform future development and research.
Importantly, the understanding of the complexity of direct observation has informed the data capture element of the pilot and confirmed that no single solution, be it drone, satellite or smartphone, would provide a complete data capture solution on its own and that a multi-mode approach is required.
PLOT STATUS MONITORING BY DRONE
The news of a fire on the May 2023 plot was initially disappointing, however by pivoting the situation to our advantage, it was possible to use the change of circumstances to test the belief that drones can detect damage / changes to planting plots.
Therefore, during the March 2023 field project, the drone was used to map previous planting plot, which was also ‘ground truthed’.
It had been feared that due to the length of time between the fire and site visit, any evidence of the burnt plot would have disappeared. However, ground truthing revealed that there were still some patches of blackened earth from the fire and that the land had remained bare, in contrast with surrounding areas.


Analysis of drone mapping March 2024. Vegetation and damage caused by the plot fire was observable.
The results of the drone aerial survey were processed and analysed. The drone mapping revealed that the scorch marks were visible from air observation, as was the contrast between this burnt land and the adjacent dry land. Further, it was also observed that the drone was able to easily image and detect both large plants and low-level vegetation vs bare earth.
Further, the aerial imagery was compared with that taken in May 2023.

Side by side comparison of the same area of land, drone mapped in May 2023 and March 2024. Clearly visible is the difference in land condition and vegetative cover.
The difference in ground status and ‘greenery’ between the two time periods was extremely evident from the aerial mapping, with the grass and low-level vegetation in May 2023 contrasting starkly with the dry bare earth observed March 2024.
The results of these tests confirmed several important points for the pilot. Firstly, that drones are able to detect changes to planting plots, be they seasonal or impact-related, such as fires. This validates drone mapping as a potential option for the ongoing monitoring of reforestation plots where ‘intelligence-led’ results can trigger the need for further ground-truthing, reducing reliance on resource intensive routine patrols.
This will help to inform future development of the pilot as it extends beyond initial planting to explore a monitoring functionality.
PLANTING DENSITY – ESSENTIAL FOR SCALING
Typically, rural community (re)forestation projects will plant a mix of different species in preference to single-species monoculture. Each species has its own optimal spacing between plants to maximise health and growth. Local Sierra Leonean examples include Cashew trees requiring to be spaced significantly further apart than Coffee shrubs.
The May 2023 planting event did not include a process of marking out planting gridlines nor planning for optimum density for the plot / species. The result was a haphazard arrangement where plants were placed with little / no regard to ideal ‘interplant spacing’ or resource efficiency. The planting data was drone/smartphone captured and represented in the image below which shows the irregular clustering of plants across the plot, with inconsistent spacing and very poor efficiency of land use.

With each pin representing a new sapling, the haphazard layout implementation of the May 2023 planting is visible.
From this prior learning, and the fact that for pilot methodology to be viable at scale it will be necessary to plant at regular intervals (spacing), to set calculated densities, a revised methodology was developed and tested.
In early March 2024, as part of the planting programme in Mansonia, Sierra Leone, three plots of 1000, 500 and 150 saplings / hectare respectively were marked out for planting. The calculations and plot marking-out were completed in advance and conducted in accordance with revised step-by-step procedures, ahead of ‘planting day’.

Local community workers marking out and planting the saplings in the gridline and row configuration layout.
As each sapling was planted, it’s QR (unique ID) code was scanned and the data for the individual plant was recorded on the smartphone, including GPS coordinates. This data was subsequently uploaded to the cloud portal and fused with the drone imagery. The labelled results taken from the data portal show the three different planting densities clearly visible next to each other, with each blue pin representing a sapling.

With each pin representing the location of a new sapling, the different planting densities were confirmed, as was the ability to detect and represent them.
In addition to this, the drone imagery was analysed in detail. The white tags from each sapling were observable.

Lining up the tags in the mapping image, it was possible to extrapolate the ‘planting gridlines’ of the revised pilot methodology, indicating a successful test of this improved process.

Combined, this triple success of (1) grid layout planting (2) planting at different densities (3) data capture at different densities, achieves a critical requirement for the pilot to be scaled to larger (re)forestation projects with different land contexts, species and planting densities in real world mass implementation.
DATA FUSION
The ultimate end point for the drone and smartphone data is their fusion and representation on an online data portal. For the purposes of clarity, the data flow and processing can be visualised as below.

This structure allows for two key outcomes to support the original (reduction of) investor hesitancy and green finance integration objectives.
The ability to conduct ‘remote audits’ of the planted land, enabling investors to monitor its status visually, without the need to conduct physical regular physical reviews.
The possibility of exporting tree planting data to enable further integration with green finance opportunities such a carbon sequestration initiatives
SMARTPHONES AND DRONES – BLENDING IS NOT JUST FOR WHISKY
With the testing and validation of the various data collection methods came greater understanding of their limitations and the opportunities they present.
A review process was conducted to combine this individual learning and develop a structure to optimise the various methods investigated. Principally, this looked at satellite mapping, drone mapping and smartphone data collection.
Although not an experiment in its own right, this development provided a framework for answering a key question of how to structure a robust process for data collection from pre-planning through to ongoing verification and monitoring.
It was clear that to satisfy objectivity, practical implementation and process robustness requirements, no single data collection mechanism is currently capable of providing a full solution and that a range of individual methods would be required, each supporting each other, to work together as a blended methodology.
Within the pilot methodology, the three data capture sources of satellite, drones and smartphones work in a structured process, each either complimenting the other or filling in gaps at the appropriate time. This was developed into the conceptual stage-by-stage model.

This blended approach, combining ‘intelligence led’ ground truthing and drone mapping, with exportable data downloads for investor / Green Finance analysis, presents a comprehensive approach that is based on learning and critical thinking, with the potential to open up (re)forestation investment.
A theoretical test was conducted to evaluate the validity of this approach, based on verification of new planting. It progressed each stage of the data capture requirements to ensure that there was an appropriate means for that point in the project. For example:
100% ground truthing is impractical for pre-survey at scale, so satellite and drones provide the ‘big picture’ ground layout data for planning.
Drones are unproven to detect individual saplings when small, but the data is captured by the app.
Smartphone planting data verified by drone detected plot activity cross referenced with geo location of each sapling.
The test validated the approach taken to blend and implement different methods at different phases of implementation, taking advantage of the capabilities of each mode to overcome the constraints of others, to the point of a viable methodology.
It also highlighted how the blended methodology reduced the opportunity and risk of fraud or false data logging, in support of increasing investor confidence in forestation initiatives.
WORTH THE EFFORT: DATA VISUALISATION = VERIFICTION
Retaining sight of the overall objective of the remote observation (drone) and smartphone data collection, is the ability to verify planting activity and subsequently provide a path to reduce (re)forestation investor hesitancy in the knowledge they can visually ‘see’ the investment implementation taking place, objectively and clearly.
Therefore, the team finalised and tested a custom data representation portal that fused the drone mapping and smartphone data. Key to this was a requirement for the fused data to be presented in a clear and intuitive format and that it could be accessed remotely.
The result was an interactive een with each pin indicating the location of a sapling, together with its details. The portal was loaded with data from both May 2023 and March 2024.

Pins relate to geo tags, and explain what data is opened up on clicking.
The end result of this development and testing activity was a clear success. The data from each sapling was displayed correctly, in a clear format that allowed intuitive access to the details of each plant, with a planting plot ‘overview’ which allows for ‘virtual verification audits’ of planting activity. The portal was tested with different web browsers (chrome, edge, safari) from different locations worldwide.
CONCLUSION
This sprint has contributed to significant learning by the team. It has validated the key principles and implementation of the pilot methodology for verification of planting activity. Further, it has also paved the way for an extension of the methodology to encompass development to support ongoing monitoring.
By presenting a verification process that is comprehensive, objective, robust and visually intuitive, with the option for detailed data exports to support formal audits the pilot methodology creates an opportunity for funding entities to receive greater transparency of the impact of their investment and confidence in its expenditure. This could provide a pathway to reduce investor hesitancy in difficult to reach areas and complex contexts, leading to increased investment in the sector.
NEXT STEPS
It should be noted that this blog is focused primarily on the technical aspects of the pilot, developing a methodology and capability to solve the technical challenges of verification in remote and difficult contexts. Considerable effort and attention has been given in parallel to this development by the project partners and stakeholders in building community engagement.
Based on the learning generated across the pilot, the anticipated next steps for technical development are as follows:
Preparing the technical capability for ongoing status monitoring of plantation plots. This will be an important requirement if the methodology is to be used for verification purposes to reduce funder hesitancy
Community scaling. This will involve development of the pilot systems and processes for engaging with new communities and providing appropriate motivation and incentive structures for ongoing livelihoods (such as eco guards and forest monitors) to provide a route beyond local subsistence farming and longer-term livelihood development
Exploring options to enable a technical portal functionality that would enable data exports that meet the requirements of green financing opportunities to support the sustainability of the initiative
Developing an operating model for an implementation project based in the Loma region. This is structured to be a mass tree planting (30million trees) project incorporating crop (food) species
PS: APPLIED LEARNING – BATTERY CHARGERS
Readers of our previous blogs will be aware of the challenges we have had charging drone batteries from the vehicle 12V electrics in the hot African climate, with one event leading to the adapter literally melting (despite the air conditioning). For March 2024 operational deployment, we used a high power ‘brick’ type of adapter with great success. Nothing overheated and the power delivery was consistent, giving us reassurance of flexibility of charging in remote settings if ever necessary.

The ’brick’ style adaptor charger worked flawlessly, even in the 40+ deg C African heat. Nothing melted and the power delivery was stable - learning applied!!